Gastric Cancer Portal:
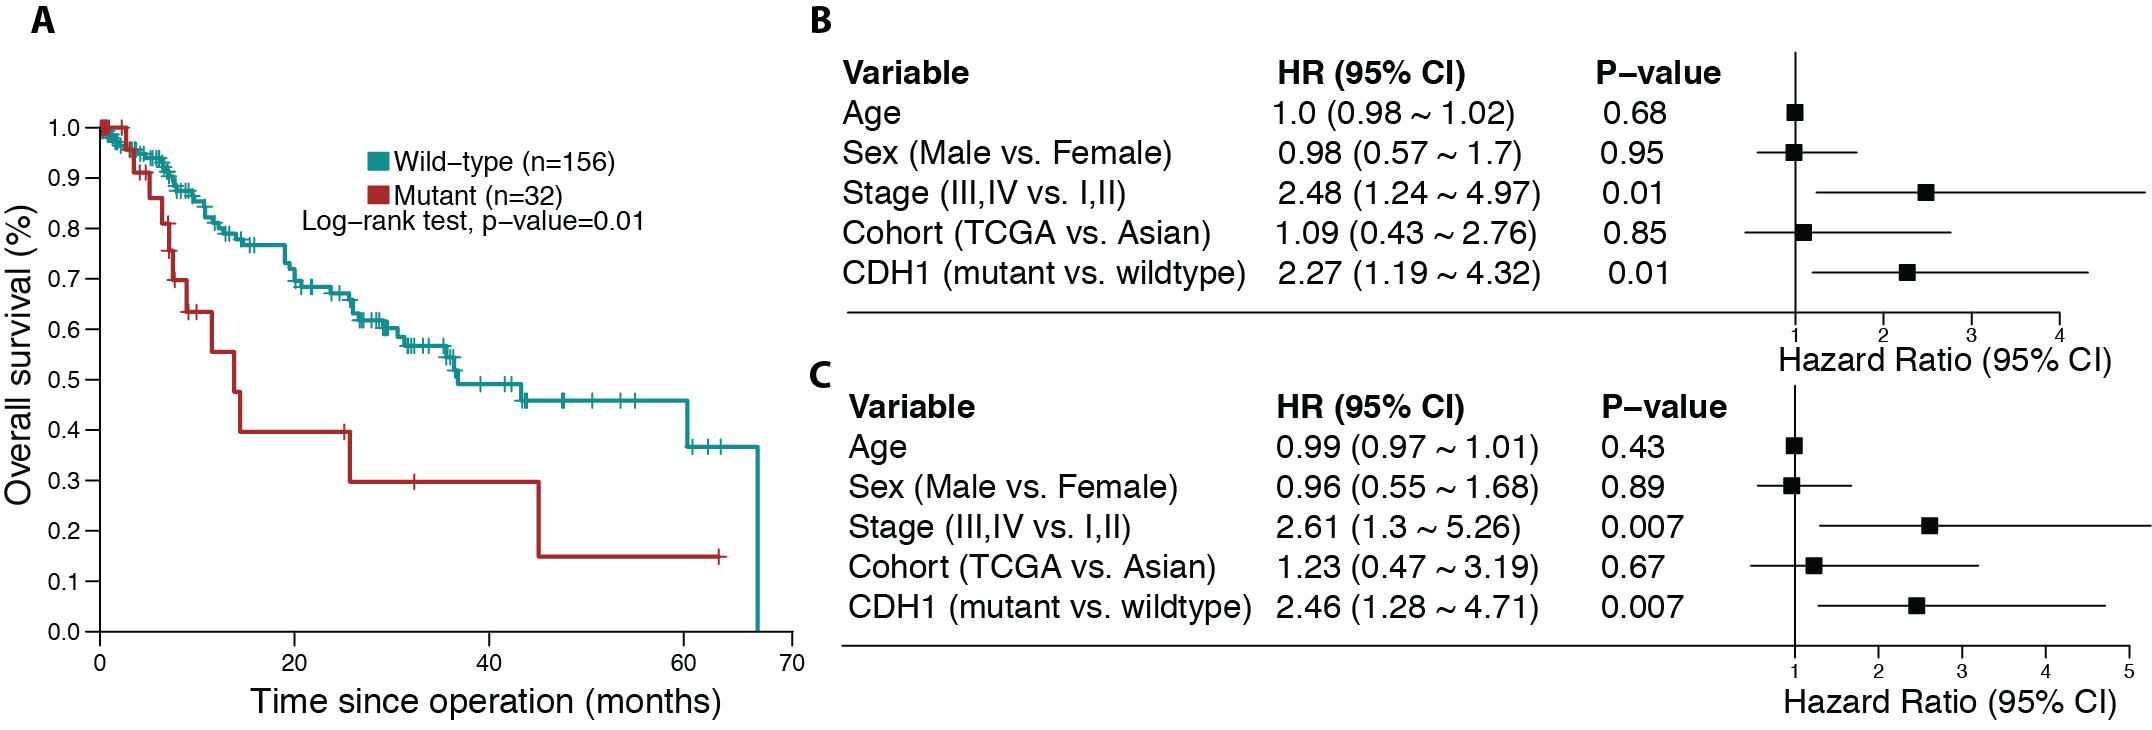
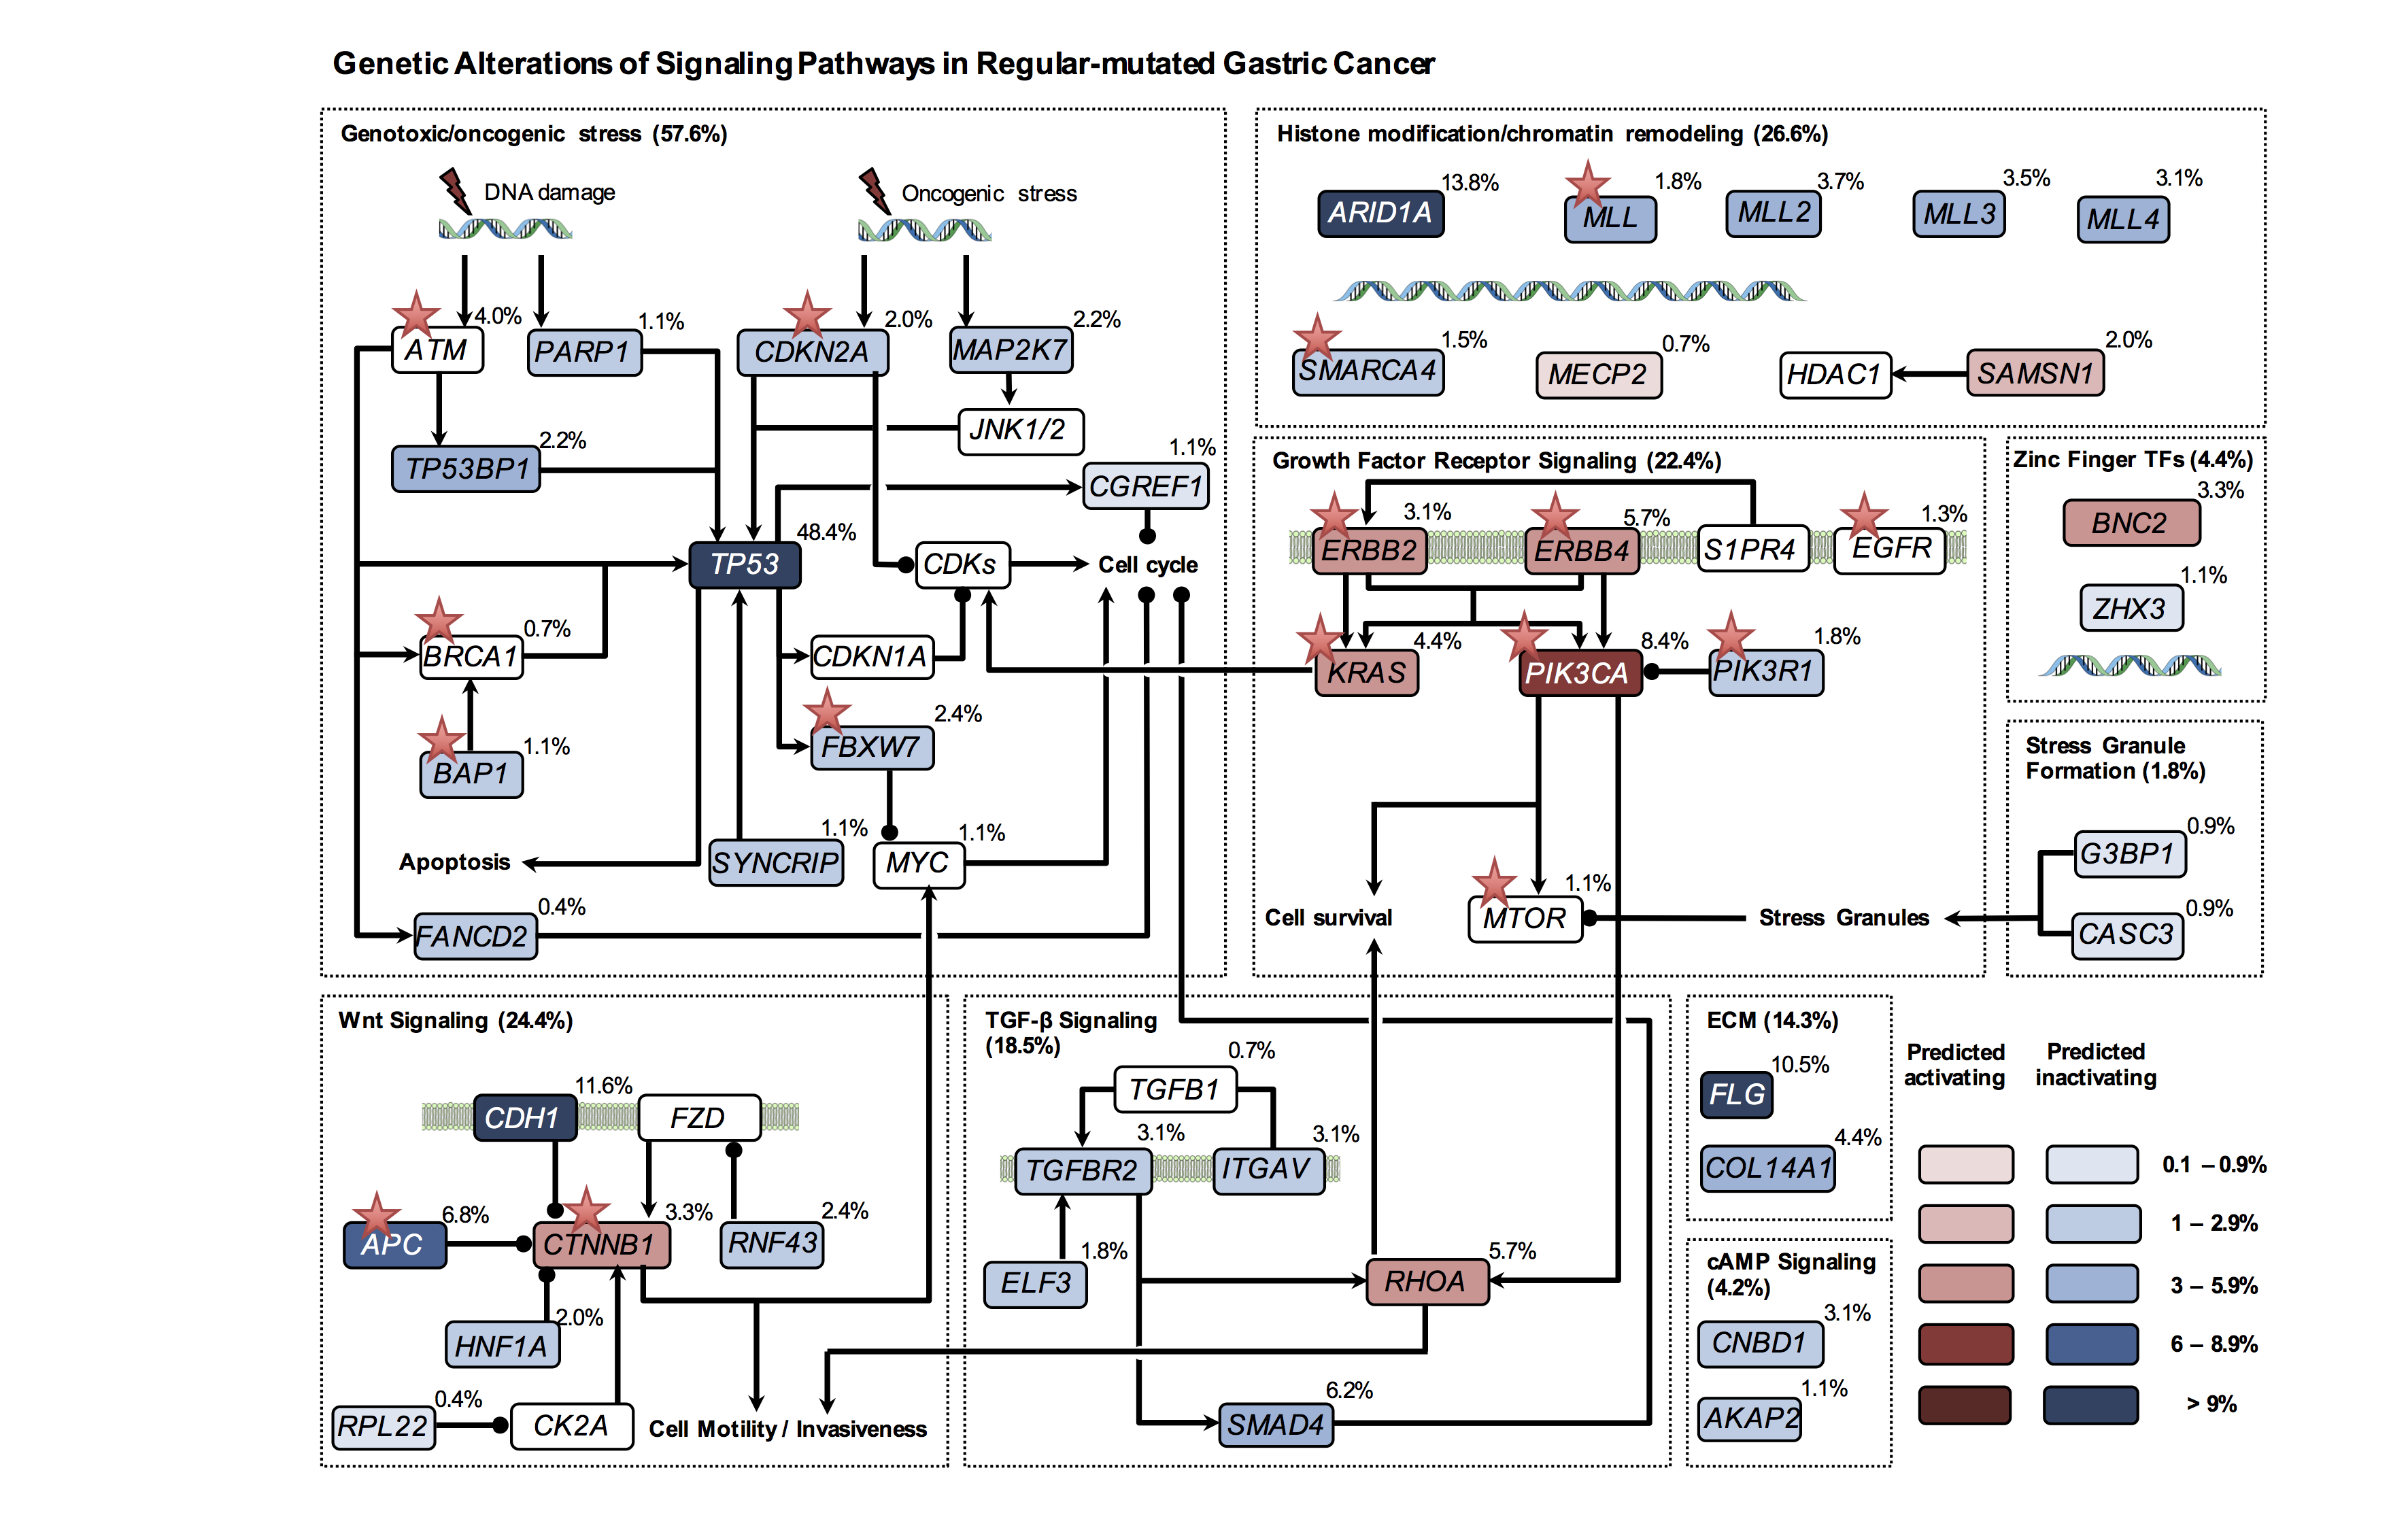
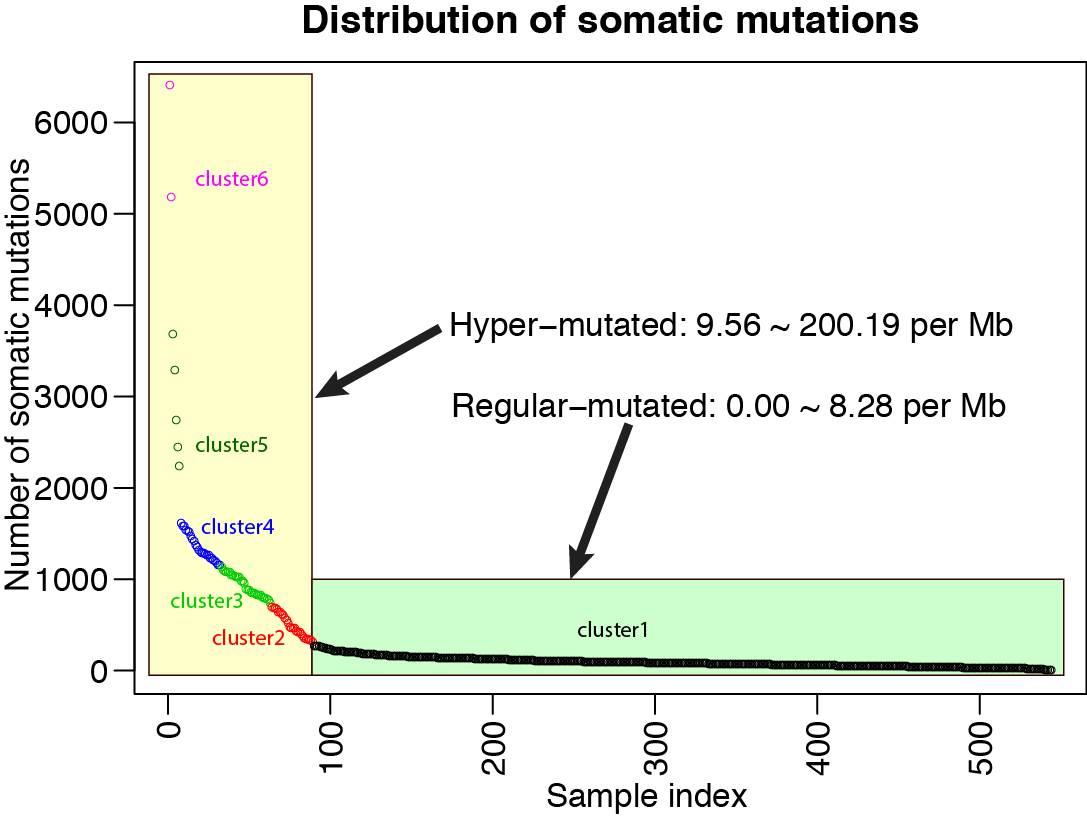
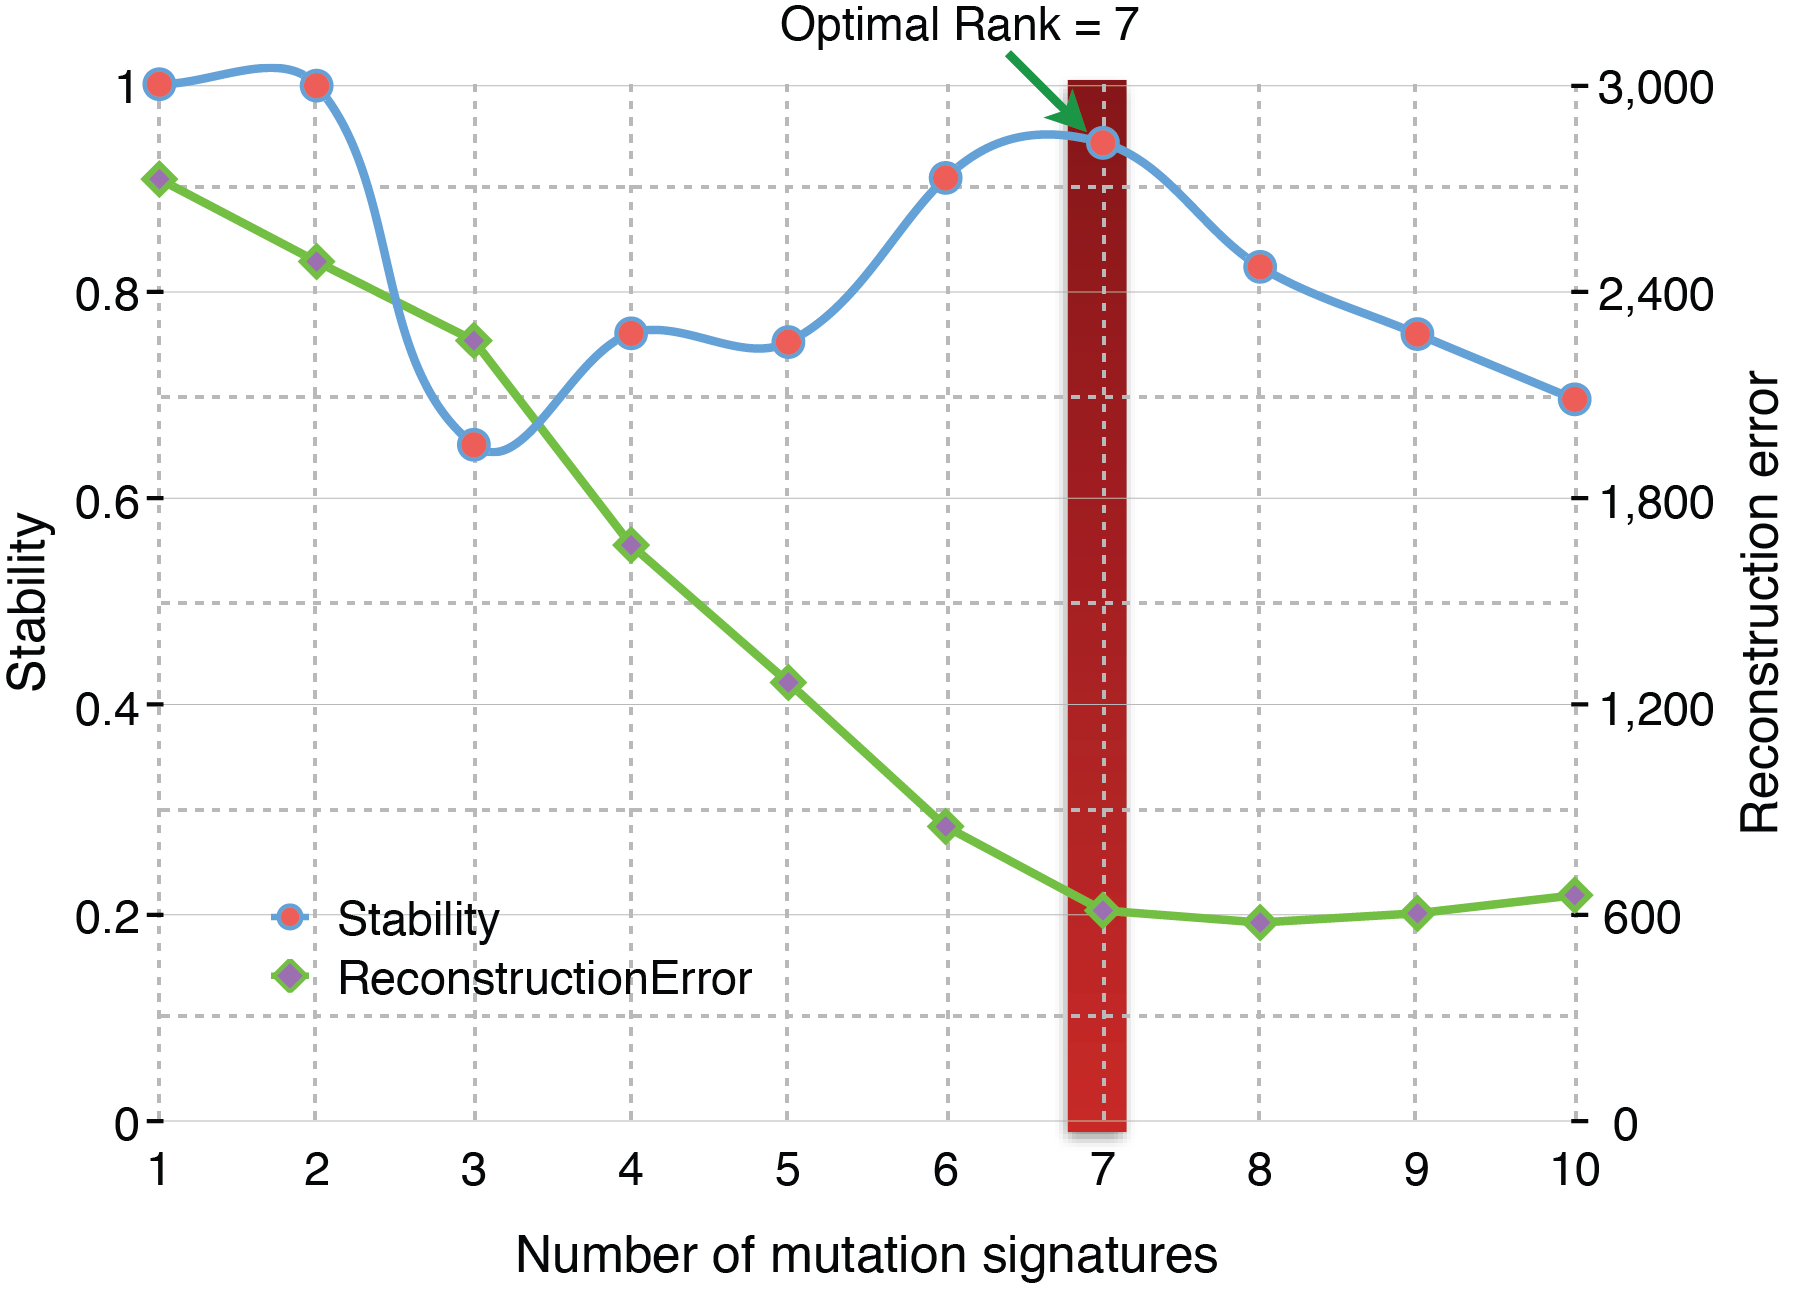
Xiangchun Li, William KK Wu, Rui Xing et al. Distinct subtypes of gastric cancer defined by molecular characterization include novel mutational signatures with prognostic capability. Cancer Research 2016
Related materials of my PhD thesis - 2016年 丙申年 【猴年】

Significantly mutated genes in regular-mutated gastric cancer

Click on a gene name to see additional annotations. MutSigCV/CL/FN were used.
Significant by CV/CL/FN
TP53
48.4% of all patients
Significant by CV/FN
ARID1A
13.8% of all patients
Significant by CV/CL/FN
CDH1
11.6% of all patients
Significant by CV/CL
PIK3CA
8.4% of all patients
Significant by CL only
XIRP2
7.3% of all patients
Significant by CV only
NBEA
7.0% of all patients
Significant by CV/CL
APC
6.8% of all patients
Significant by CV/CL/FN
SMAD4
6.2% of all patients
Significant by CL only
ERBB4
5.7% of all patients
Significant by CV/CL
RHOA
5.7% of all patients
Significant by CV/CL
KRAS
4.4% of all patients
Significant by CV only
COL14A1
4.4% of all patients
Significant by CL only
AKAP6
3.7% of all patients
Significant by CL only
CDH11
3.7% of all patients
Significant by CV/CL/FN
CTNNB1
3.3% of all patients
Significant by CL only
BNC2
3.3% of all patients
Significant by CL only
ERBB2
3.1% of all patients
Significant by CV only
ITGAV
3.1% of all patients
Significant by CV/FN
TGFBR2
3.1% of all patients
Significant by CL only
CNBD1
3.1% of all patients
Significant by CV
RNF43
2.4% of all patients
Significant by CV/FN
FBXW7
2.4% of all patients
Significant by CV only
MAP2K7
2.2% of all patients
Significant by CV only
CDKN2A
2.0% of all patients
Significant by CV only
SAMSN1
2.0% of all patients
Significant by CV only
PIK3R1
1.8% of all patients
Significant by CV only
ELF3
1.8% of all patients
Significant by CV only
PIGR
1.8% of all patients
Significant by CL only
THEMIS
1.3% of all patients
Significant by FN only
AKAP2
1.1% of all patients
Significant by CL only
ZHX3
1.1% of all patients
Significant in my pnas.1422640112
NRG1
2.64% of all patients

Significantly mutated genes in hyper-mutated gastric cancer

Click on a gene name to see additional annotations. MutSigCV/CL/FN were used. Only SNVs were included
Significant by CV/FN
ARID1A
30.3% of all patients
Significant by CV/FN
TP53
23.6%% of all patients
Significant by CV/CL
PIK3CA
16.9%% of all patients
Significant by CV/CL
KRAS
2.2% of all patients

Mutational signatures operative in 544 exomes of gastric cancer

Click on mutational signature and hover your mouse over to see detail information.
Mutational signature 1
Operative in 11.9% RGC and 10.1% HGC
Mutational signature 2
Operative in 59.3% RGC and 82% HGC
Mutational signature 3
Operative in 0.7% RGC and 3.4% HGC
Mutational signature 4
Operative in 2% RGC and 80.9% HGC
Mutational signature 5
Operative in 1.1% RGC and 51.7% HGC
Mutational signature 6
Operative in 70.8%% RGC and 10.1% HGC
Mutational signature 7
Operative in 0.4%% RGC and 80.9% HGC
Mutational exposures
Pie chart representation
Compare with nature paper Alexandrov L. B. et al
21 mutational signatures
Cosine similarity

Mutational signatures operative in 100 WGS of gastric cancers

Click on mutational signature and hover your mouse over to see detail information.
Stability & Reconstruction error
Optimal mutation signature number = 9
Mutational signature 1
Operative in 11.9% RGC and 10.1% HGC
Mutational signature 2
Operative in 59.3% RGC and 82% HGC
Mutational signature 3
Operative in 0.7% RGC and 3.4% HGC
Mutational signature 4
Operative in 2% RGC and 80.9% HGC
Mutational signature 5
Operative in 1.1% RGC and 51.7% HGC
Mutational signature 6
Operative in 70.8%% RGC and 10.1% HGC
Mutational signature 7
Operative in 0.4%% RGC and 80.9% HGC
Mutational signature 8
Operative in 0.4%% RGC and 80.9% HGC
Mutational signature 9
Operative in 0.4%% RGC and 80.9% HGC
Mutational exposures
Pie chart representation
Mutation distribution
Scatter plot ordered by cluster ID
Compare with nature paper Alexandrov L. B. et al
21 mutational signatures
Cosine similarity

Main and supplementary figures

Click on a mutational signature to see corresponding main figures.
Overall mutational spectra
Mutational spectra of RGC & HGC
Main Figure 1
Mutational & APOBEC signature in RGC vs. HGC.
Main Figure 2
SMG & molecular. subtypes et al.
Main Figure 3
Mutation plot of PIK3CA in RGC vs. HGC
Main Figure 4
CDH1 mutations as a prognosticator in DGC
Altered pathways in GC
Druggable target marked with red star
Mutational burden clustering
Clustering based on dynamic programming
Signature deciphering
Metrics of signature deciphering
Kernal PCA
Kernal PCA for mutational exposures
Survival analysis of C1/2
KM survival analysis of C1/C2 in DGC and HGC
C1/2 in validation cohort
Prognosis of C1/2 in validation cohort
CDH1 in validation cohort
Prognosis of CDH1 mutation(s) in validation cohort
MSig in RGC vs HGC
Importance scores of mutational signatures
.
Total visited times